
Sandbag to springboard: Explaining Reform's local elections breakthrough
When First Past the Post goes from foe to friend

The Swingometer has been quiet for the past few months as I’ve had my hands full with another writing project - ‘The British General Election of 2024’, the latest in the long series of ‘Nuffield’ election books covering every election since 1945. I’m pleased to say this book is now in the production process with the publishers, and will be out later this autumn. Co-written with Tim Bale, Will Jennings and Paula Surridge, and featuring a host of brilliant contributors, there will be plenty more here and elsewhere on our account of last year’s general election in coming weeks. The book can be pre-ordered already - links below (ignore the publication dates, these are placeholders and the book will be coming well before this):
And now, on with the show!
Breakthrough: Reform in May
This year’s local elections are worth pondering as we consider whether Nigel Farage and Reform really could sweep to power in Westminster from a standing start on just 30% of the national vote. Because in May they did exactly that.
Reform’s performance in this May’s local elections broke a host of records. They became the first party other than Labour or the Conservatives to top the poll in terms of votes cast and seats won in an English local election cycle since the current system of English local government was instituted in the early 1970s, and the first party other than Labour or Conservative to top the poll on the BBC’s Projected National Share measure since it was introduced in the early 1980s. Having won nothing at all when these councils were last contested in 2021, Reform won 637 seats, over 40% of those up, and took majority control of 10 councils. And all this was done on a projected national share of the vote of 30% - a record showing, to be sure, but still less than a third of votes cast. This was, by any metric, a remarkable result. How did it happen?
Figure 1: Council seats won by party, 2021 and 2025
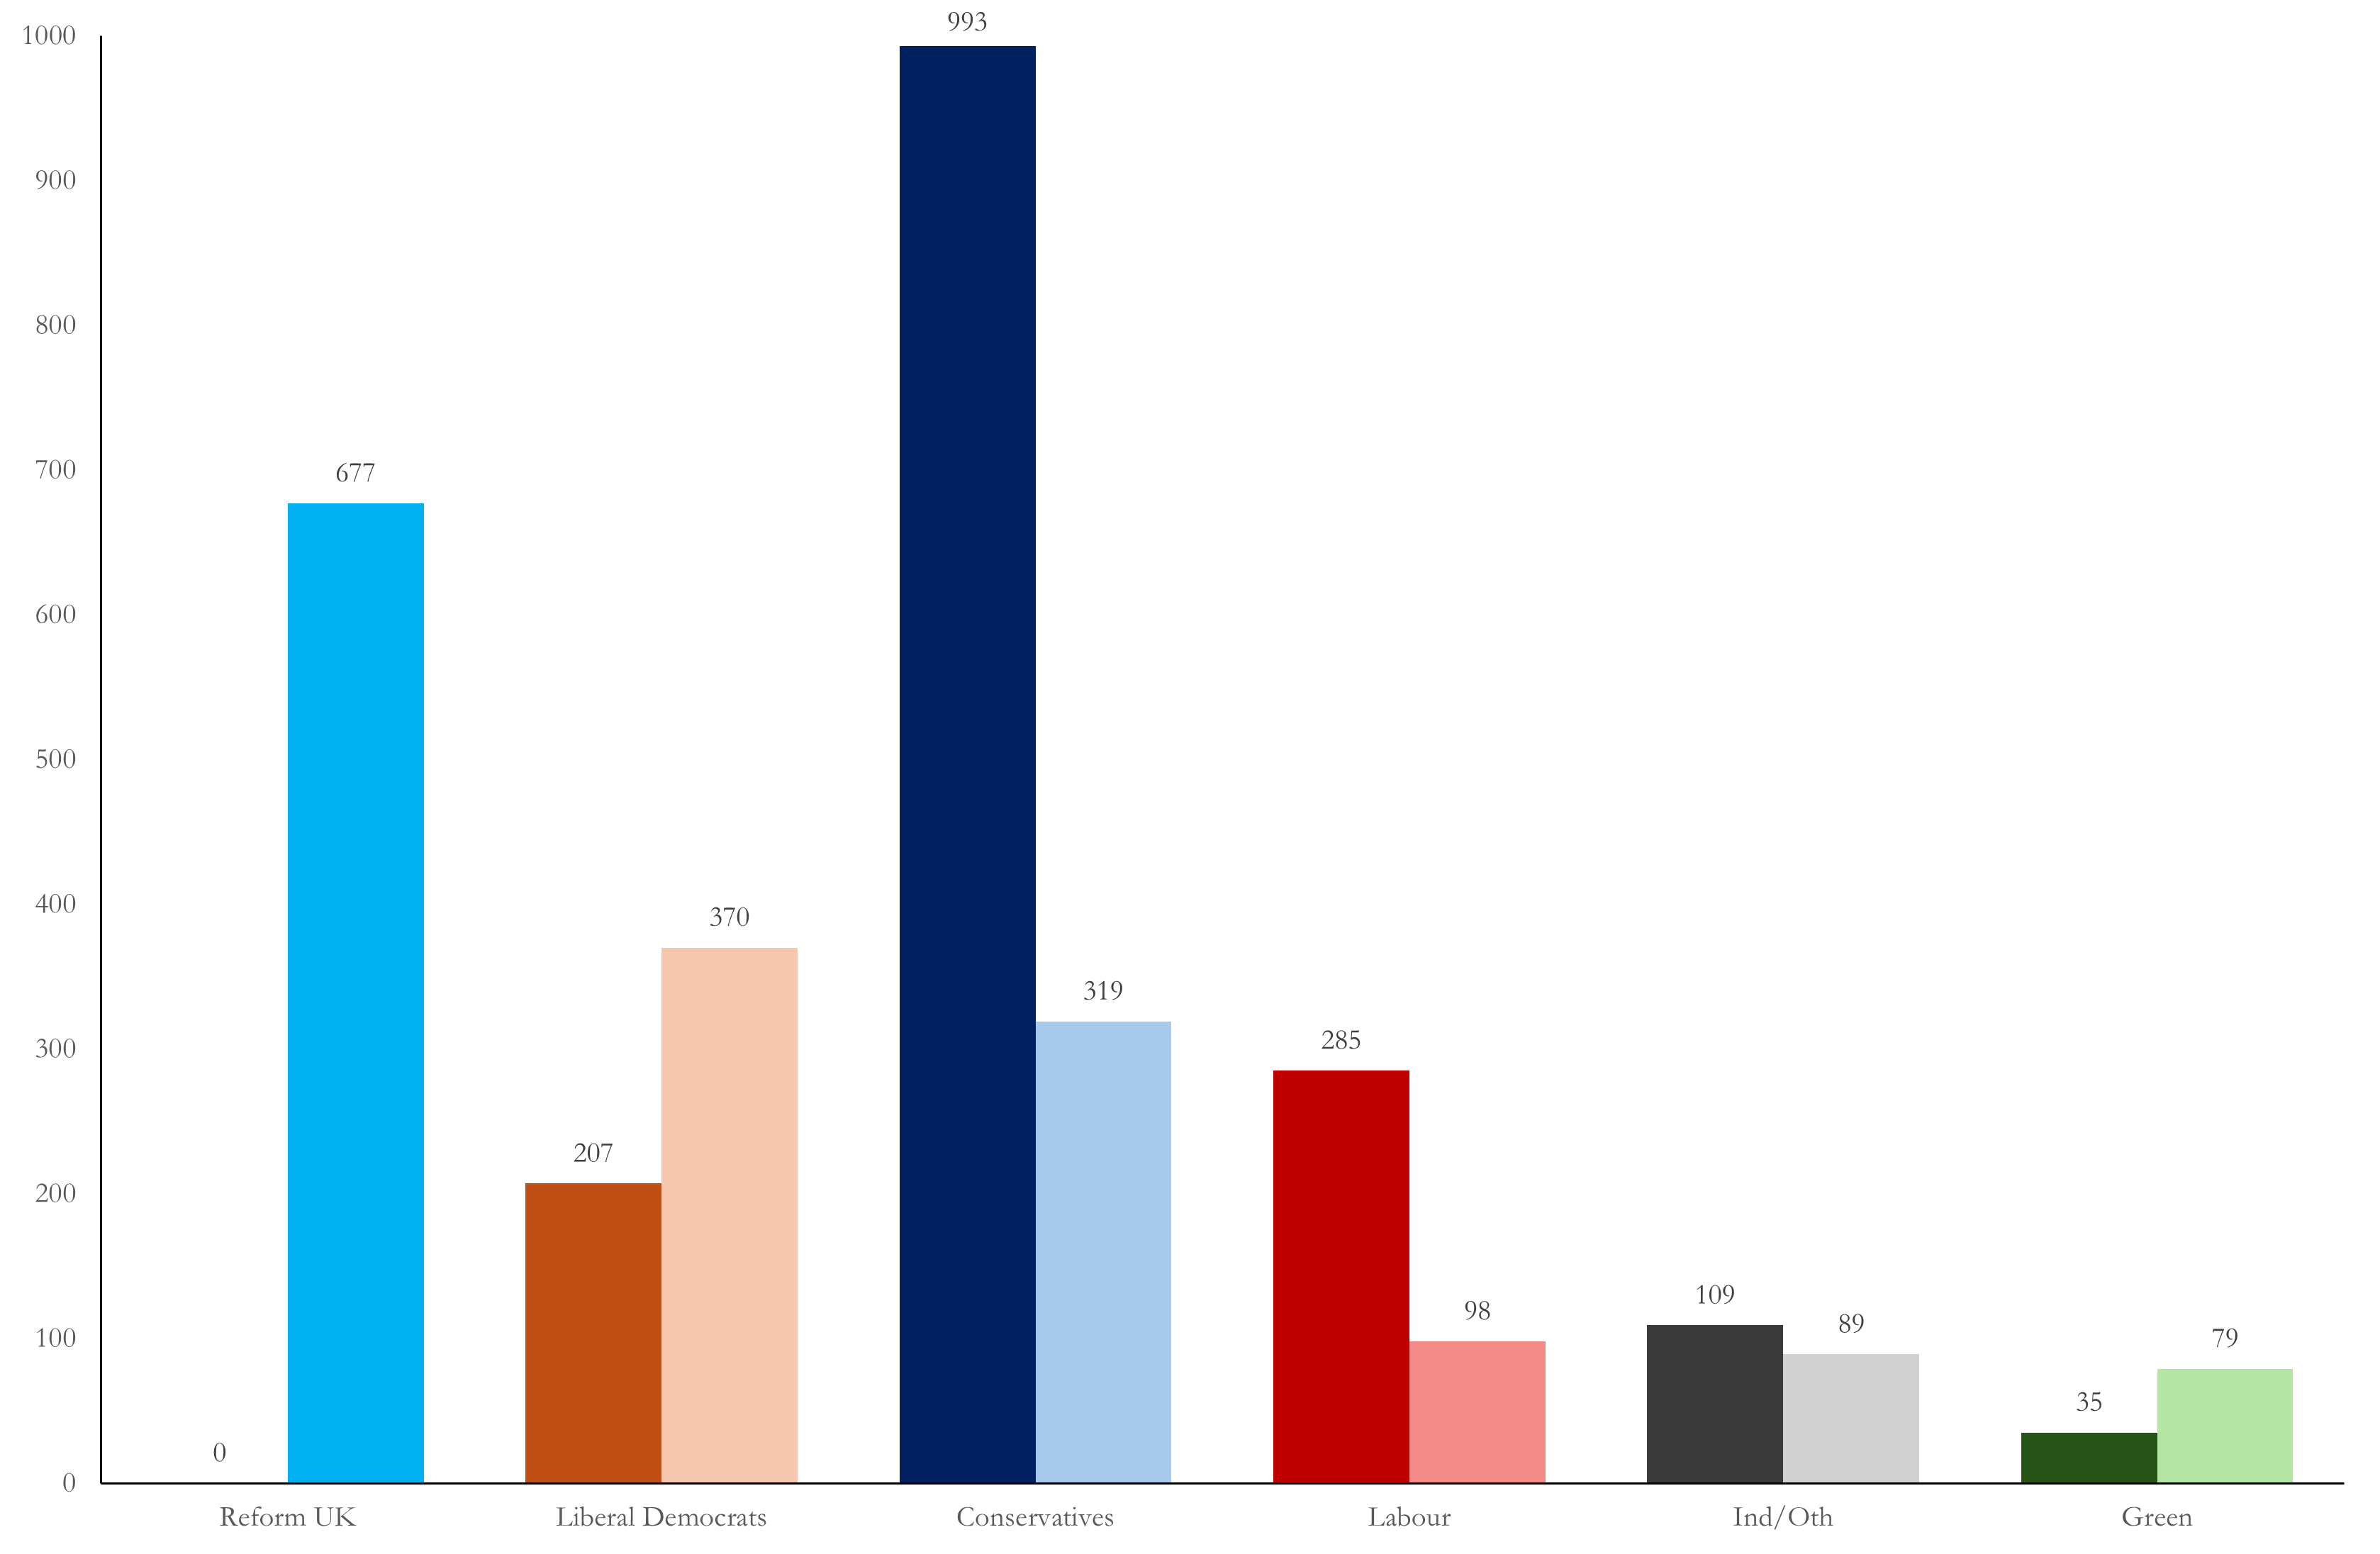
Source: BBC Dark bars: 2021, lighter bars 2025. No bar for Reform 2021 as they won zero seats that year.
Reform weren’t the only winners in May - the Liberal Democrats nearly doubled their seat total from 207 to 370, while the Greens also doubled their seats from 35 to 79. But the biggest shift seems to be on the right, with the Conservatives collapsing to third place, and Reform surging into the lead.
But while the aggregate results suggest a reshuffling of the electoral deck on the right, appearances can be misleading. The councils up this time were predominantly county councils in the more rural bits of England, traditionally strong Tory terrain, and they were last contested in 2021, at the peak of the Boris Johnson vaccine bounce, when the Conservatives were regularly polling above 40% and posting double digit leads over Labour (yes, this was just four years ago).1 Given such a context, the Conservatives were bound to lose the most ground to Reform as the party defending well over half the seats being contested had by far the most ground to lose.
In Figure 2, we even up the comparison by looking at Reform’s relative success capturing Conservative, Labour and Liberal Democrat held seats. Both traditional parties of government collapsed in May, with the Tories holding on to just 32% of their seats overall, while Labour held just 28%. Reform were the main gainers in both cases: the Conservatives lost 45% of their 2021 seats to Reform this time, while Labour lost half of their seats to Farage’s party. The Liberal Democrats, by contrast, held over 90% of the seats they were defending and lost just 4% of their seats to Reform. The sources of Lib Dem resilience to the Reform challenge require an extended analysis of their own, which I hope to come to in a future post. The key point for our current purposes is this - though the Tories lost more seats this time as they had more to lose, Labour incumbents up for election in May proved just as vulnerable.
Figure 2 - Results in 2025 by winning party in 2021
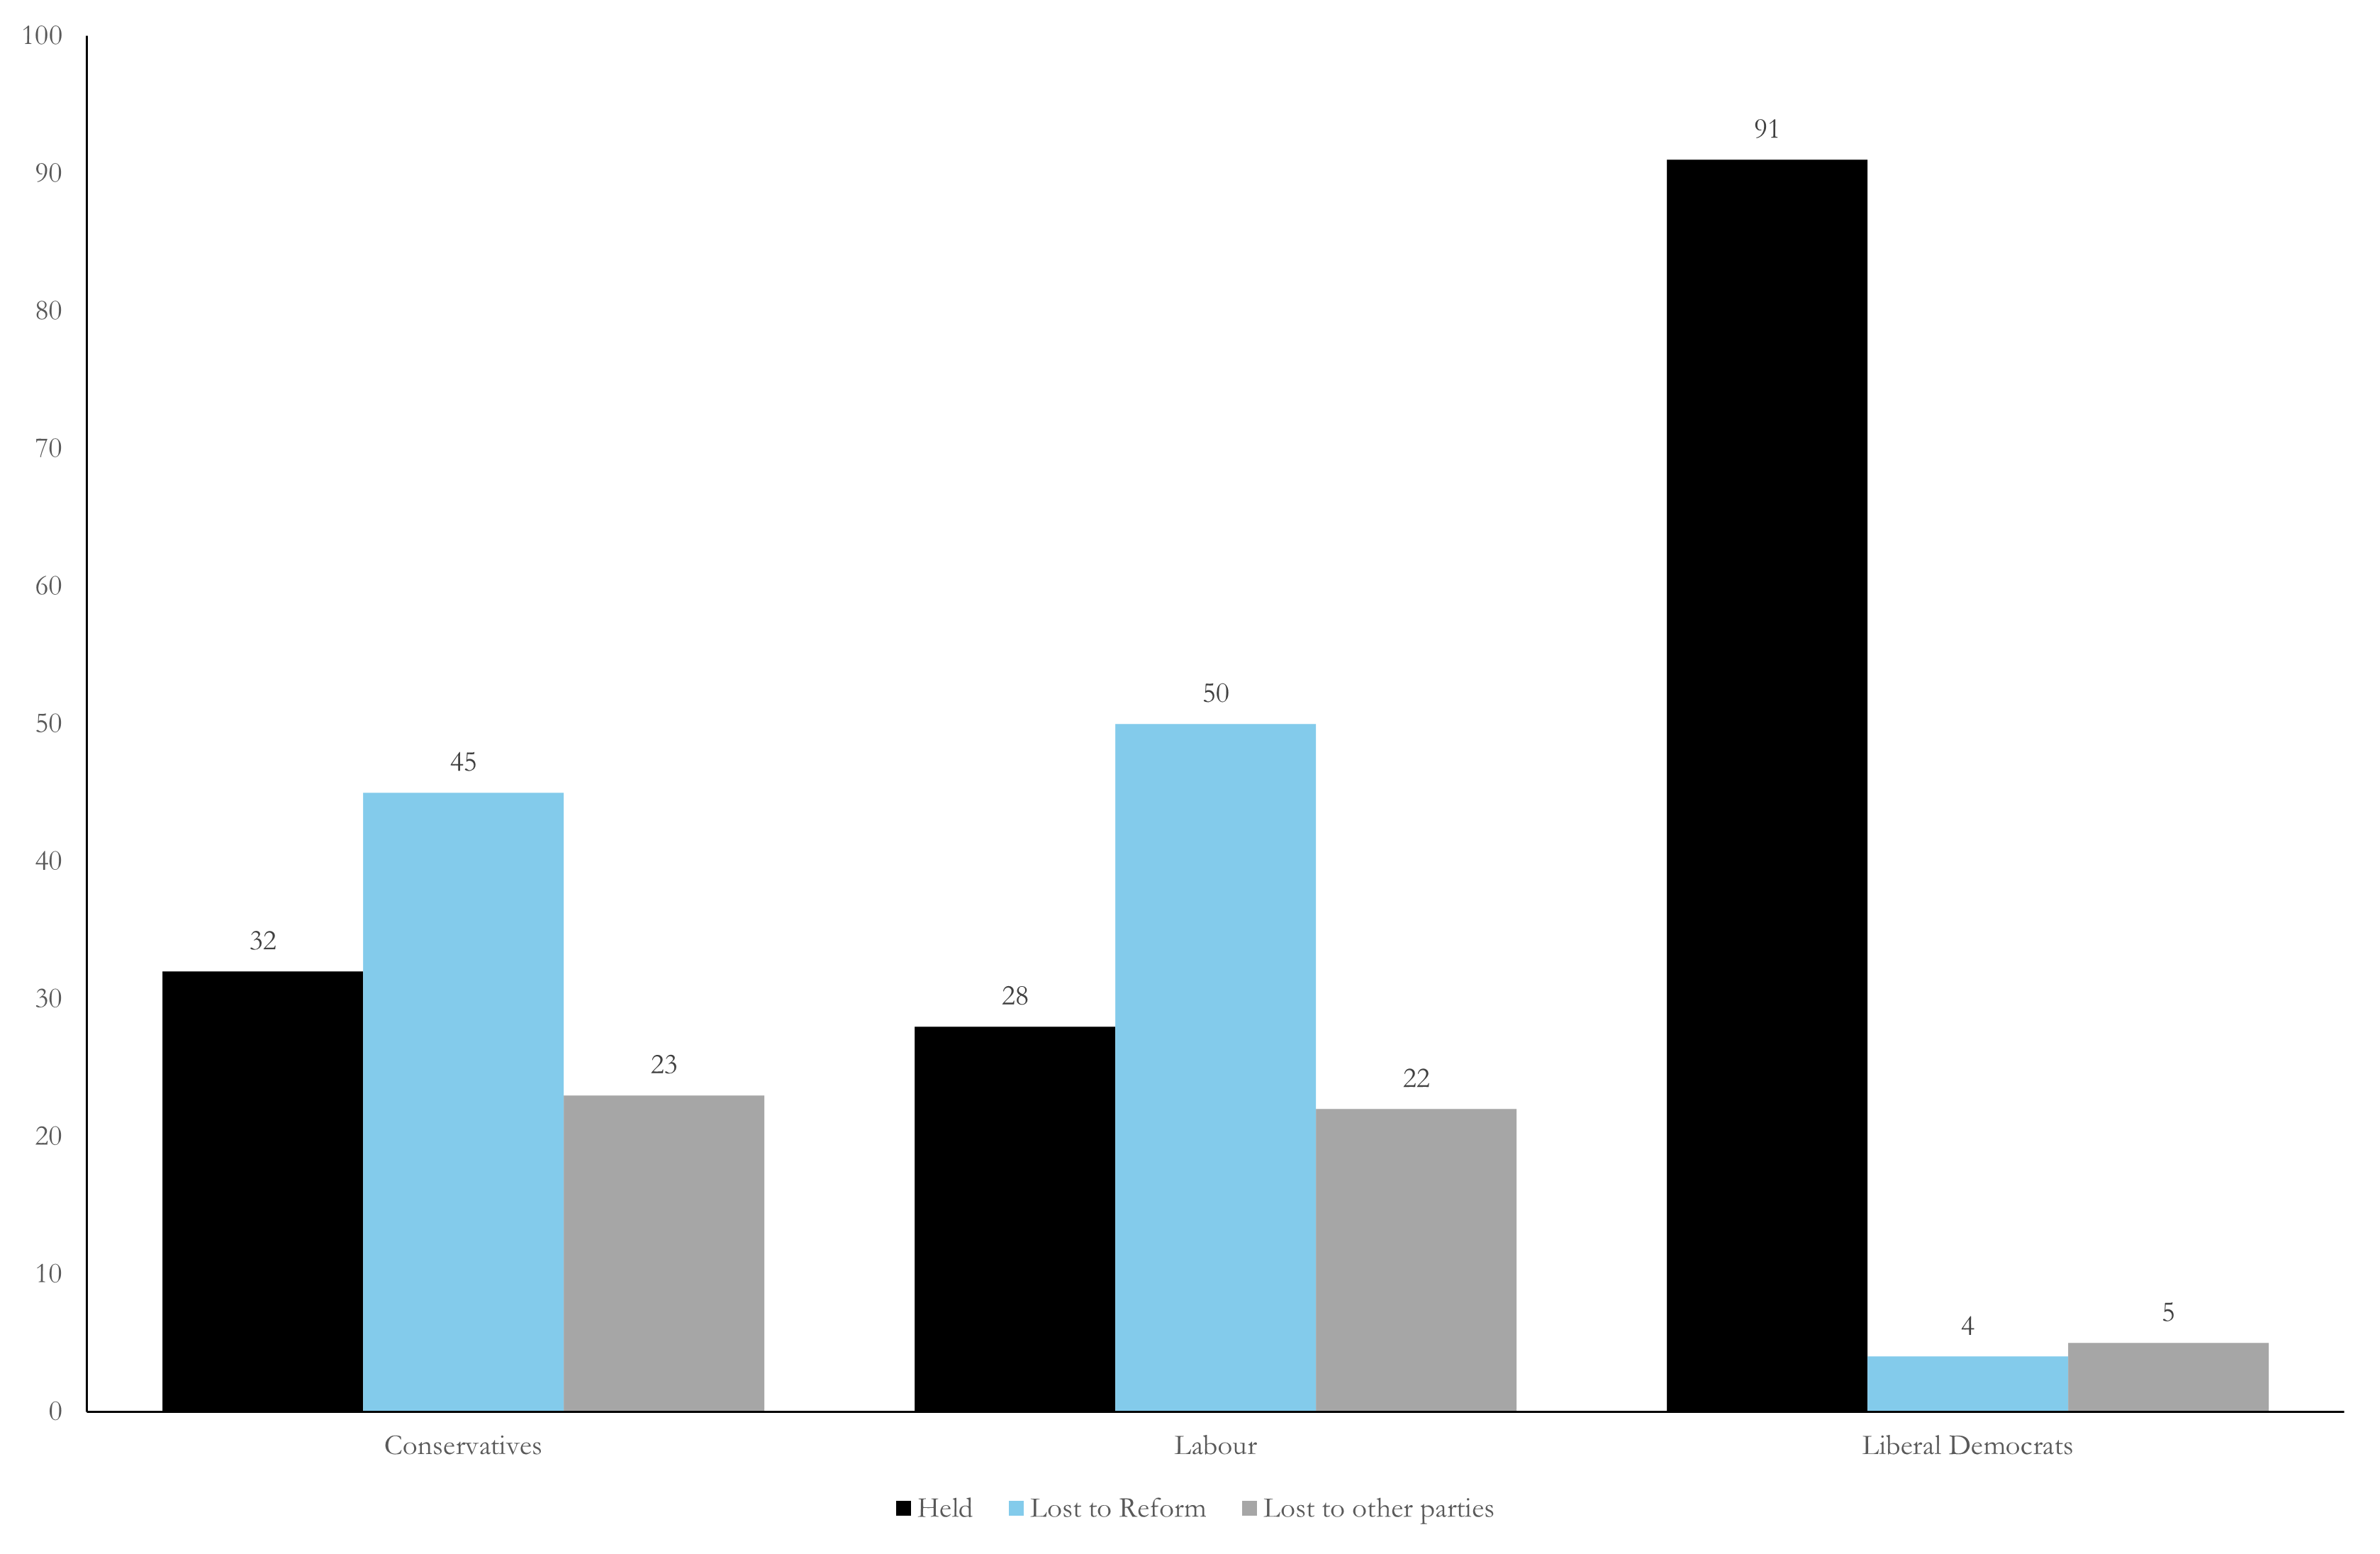
Source: BBC local elections database2
From sandbag to springboard: hitting the magic threshold
Reform thus flattened both of the traditional parties who dominate local and national government at the same rate, and at the same time. That is no mean feat. The key to this remarkable success lies in the first past the post (FPP) electoral system used in English local elections, as it is in Westminster contests. Traditionally, this system has been a sandbag for young insurgent parties, who typically can’t secure enough votes to win seats and are therefore vulnerable to being seen as a ‘wasted vote’. But once a rising party pass a certain threshold of popularity, FPP turns from foe to friend, as the party moves from silver medals across the board to narrow wins everywhere.
Figure 3 illustrates this “sandbag to springboard” effect in practice, plotting the average Reform vote share (dark bars) and share of seats won (light bars) in the councils contested in 2025. The dashed line shows Reform’s BBC Projected National Share of 30%. This proves to be a crucial threshold. In councils such as Buckinghamshire, Wiltshire and Gloucestershire where Reform candidates averaged below 30%, the party was penalised by the electoral system, winning a lower share of seats than votes. For example, in Wiltshire Reform won nearly a quarter of the vote, but just 10% of the seats.
But once Reform’s vote share rises above that crucial 30% threshold the share of seats they win shoots up. Reform secured an electoral system bonus - a higher share of seats than votes - in all but one of the councils where their average vote share was above 30%. They suffered an electoral system penalty - a lower share of seats than votes - in all but one of the councils where their average showing was below 30%. Many of these FPP bonuses and penalties were massive - Reform won 70% of the seats on Kent council with an average ward vote of 36.5%; a similar average vote (36.8%) delivered two thirds of the seats in Doncaster. In Oxfordshire and Buckinghamshire, Reform won a fifth of the vote, but virtually no seats.
At a certain point, first past the post drastically magnifies and accelerates change. Below 29%, Reform win few seats anywhere, and control nothing. Above 33%, just a few percentage points more, Reform win most seats everywhere, and control every town hall.3 The 30% they won overall in 2025 sits right at the tipping point where change accelerates.
Figure 3: Spot the springboard - Reform mean vote share and share of seats won by council, 2025
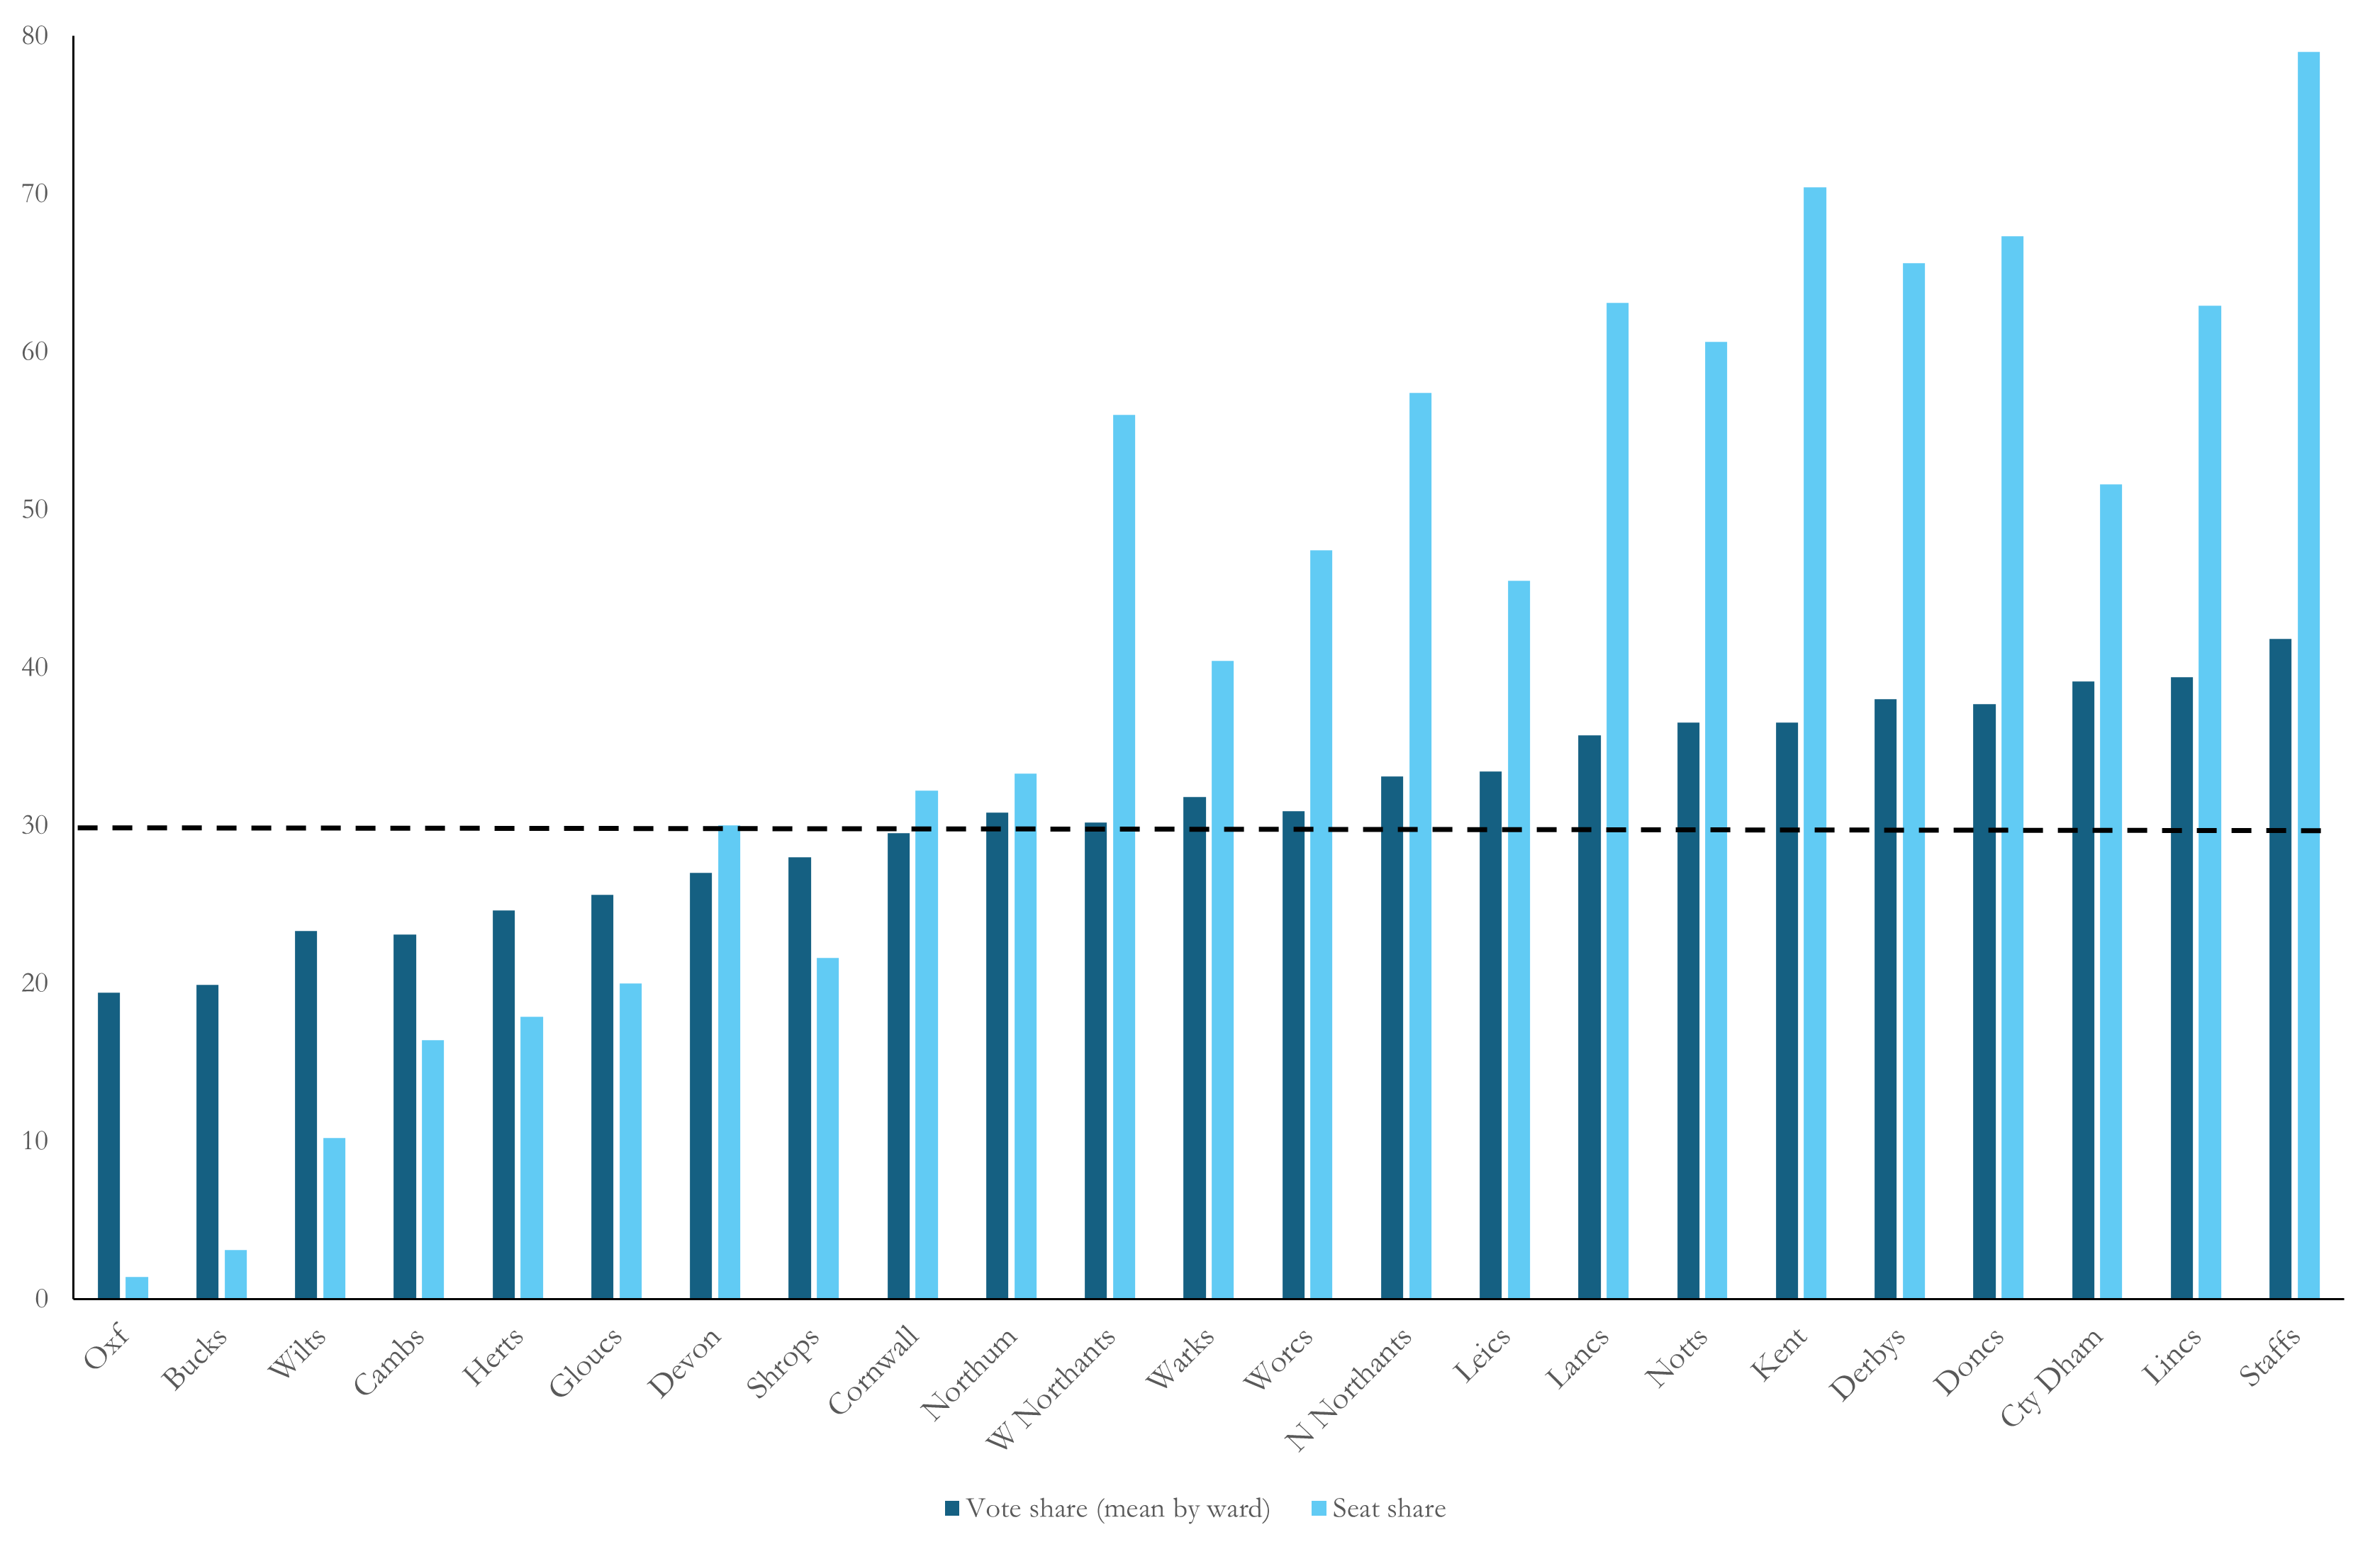
Source: BBC local elections database
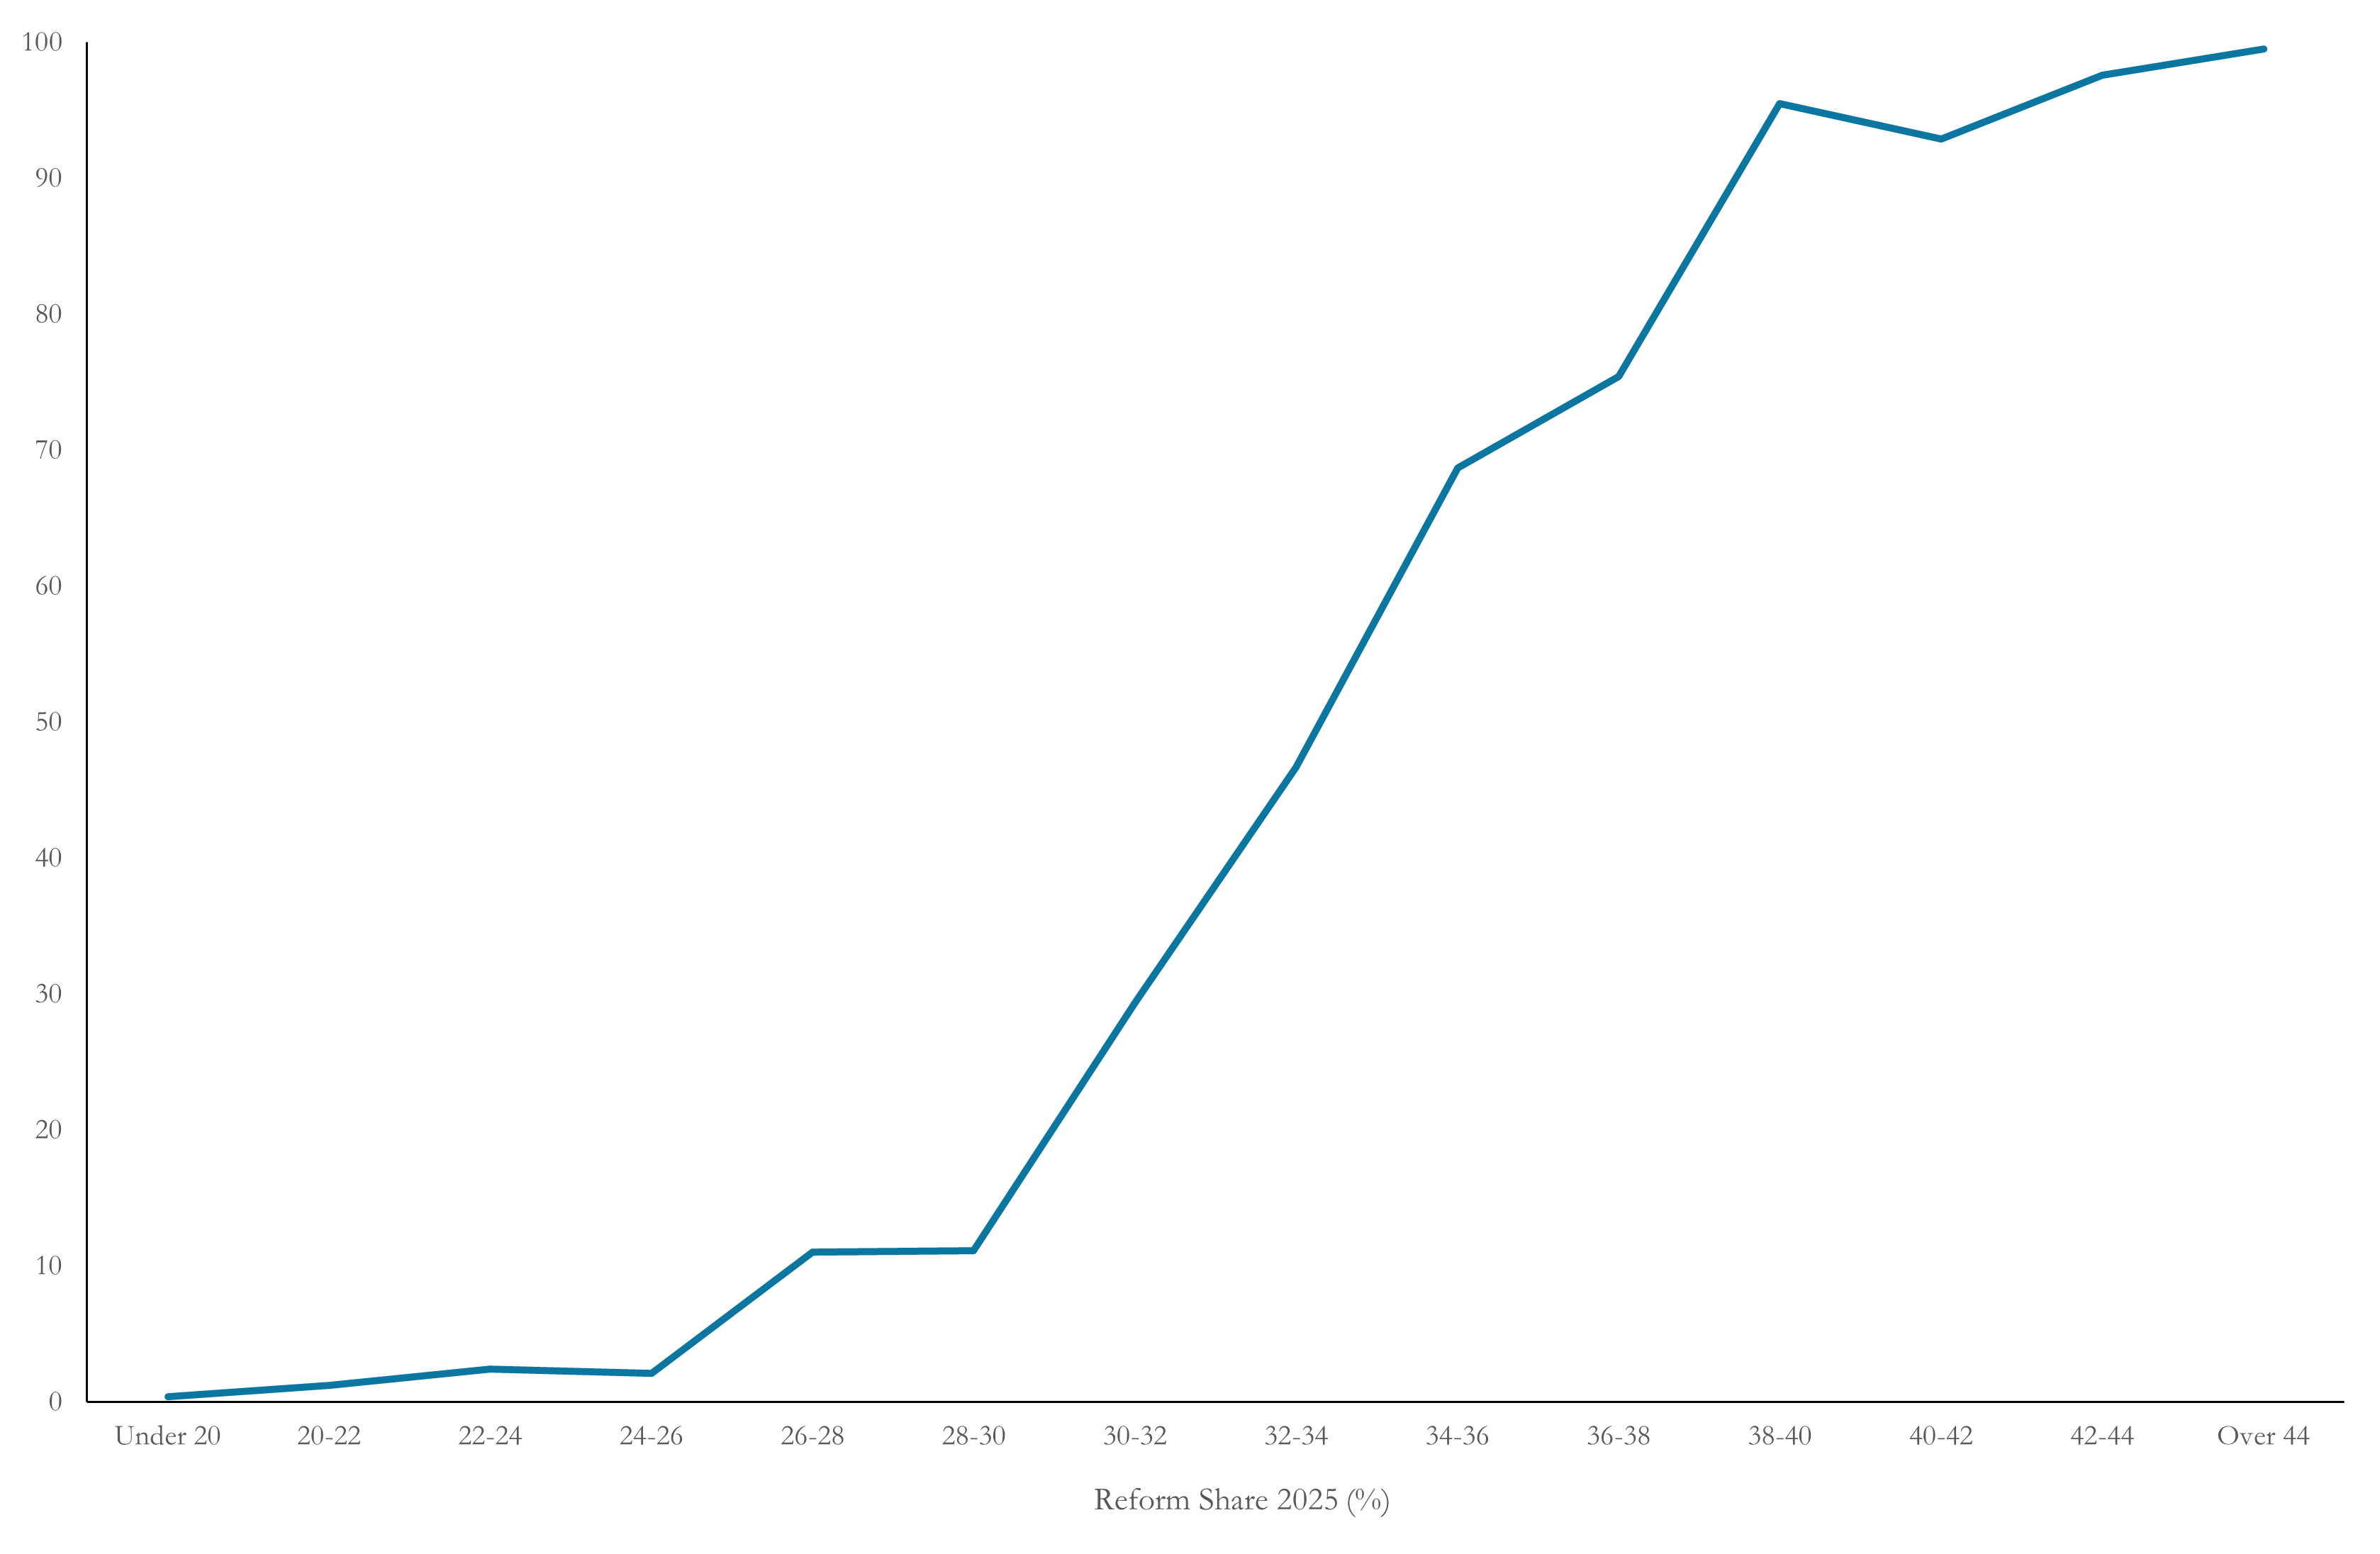
The story of accelerating change as we pass the threshold is even clearer when we look at ward level results in figure 4. Here we plot the share of all seats Reform won at different levels of 2025 vote. Reform get sandbagged in the wards where they got under 30% of the local vote, winning rarely. But once we pass 30% the FPP springboard kicks in fast: Reform win 11% of the wards where the poll 28-30%, 29% of the wards where they won 30-32%, 47% of the wards where they won 32-34% and 69% of the wards where they won 34-36%. Above that, electoral dominance is nearly total.
Figure 4: Spot the springboard: Share of seats won by Reform, by Reform 2025 vote share
Source: BBC local elections database
Bigger and Broader
For Reform, then, life begins at thirty: below 30% they seldom win, but above it their rise to dominance is rapid indeed. This powerful FPP springboard effect means it is more efficient for Reform to win 35% or so everywhere than to secure 40% in some places and 20% in others. And that, in turn, is the second secret to Reform’s success this May - their vote is not just bigger than ever, it is more efficiently spread. We can see that by comparing Reform’s support with that won by Nigel Farage’s previous radical right insurgent party - UKIP. ‘Peak UKIP’ came in 2013, when most of the same councils were up for election as this May. UKIP then won around 25% of the vote on average in the seats it stood and won 147 seats - Reform won just a few percentage points more vote on average, but over four times as many seats, despite fewer seats being available to win.
Figure 5: Reform 2025 shares and gains on UKIP 2013 by UKIP 2013 share, district council overall shares
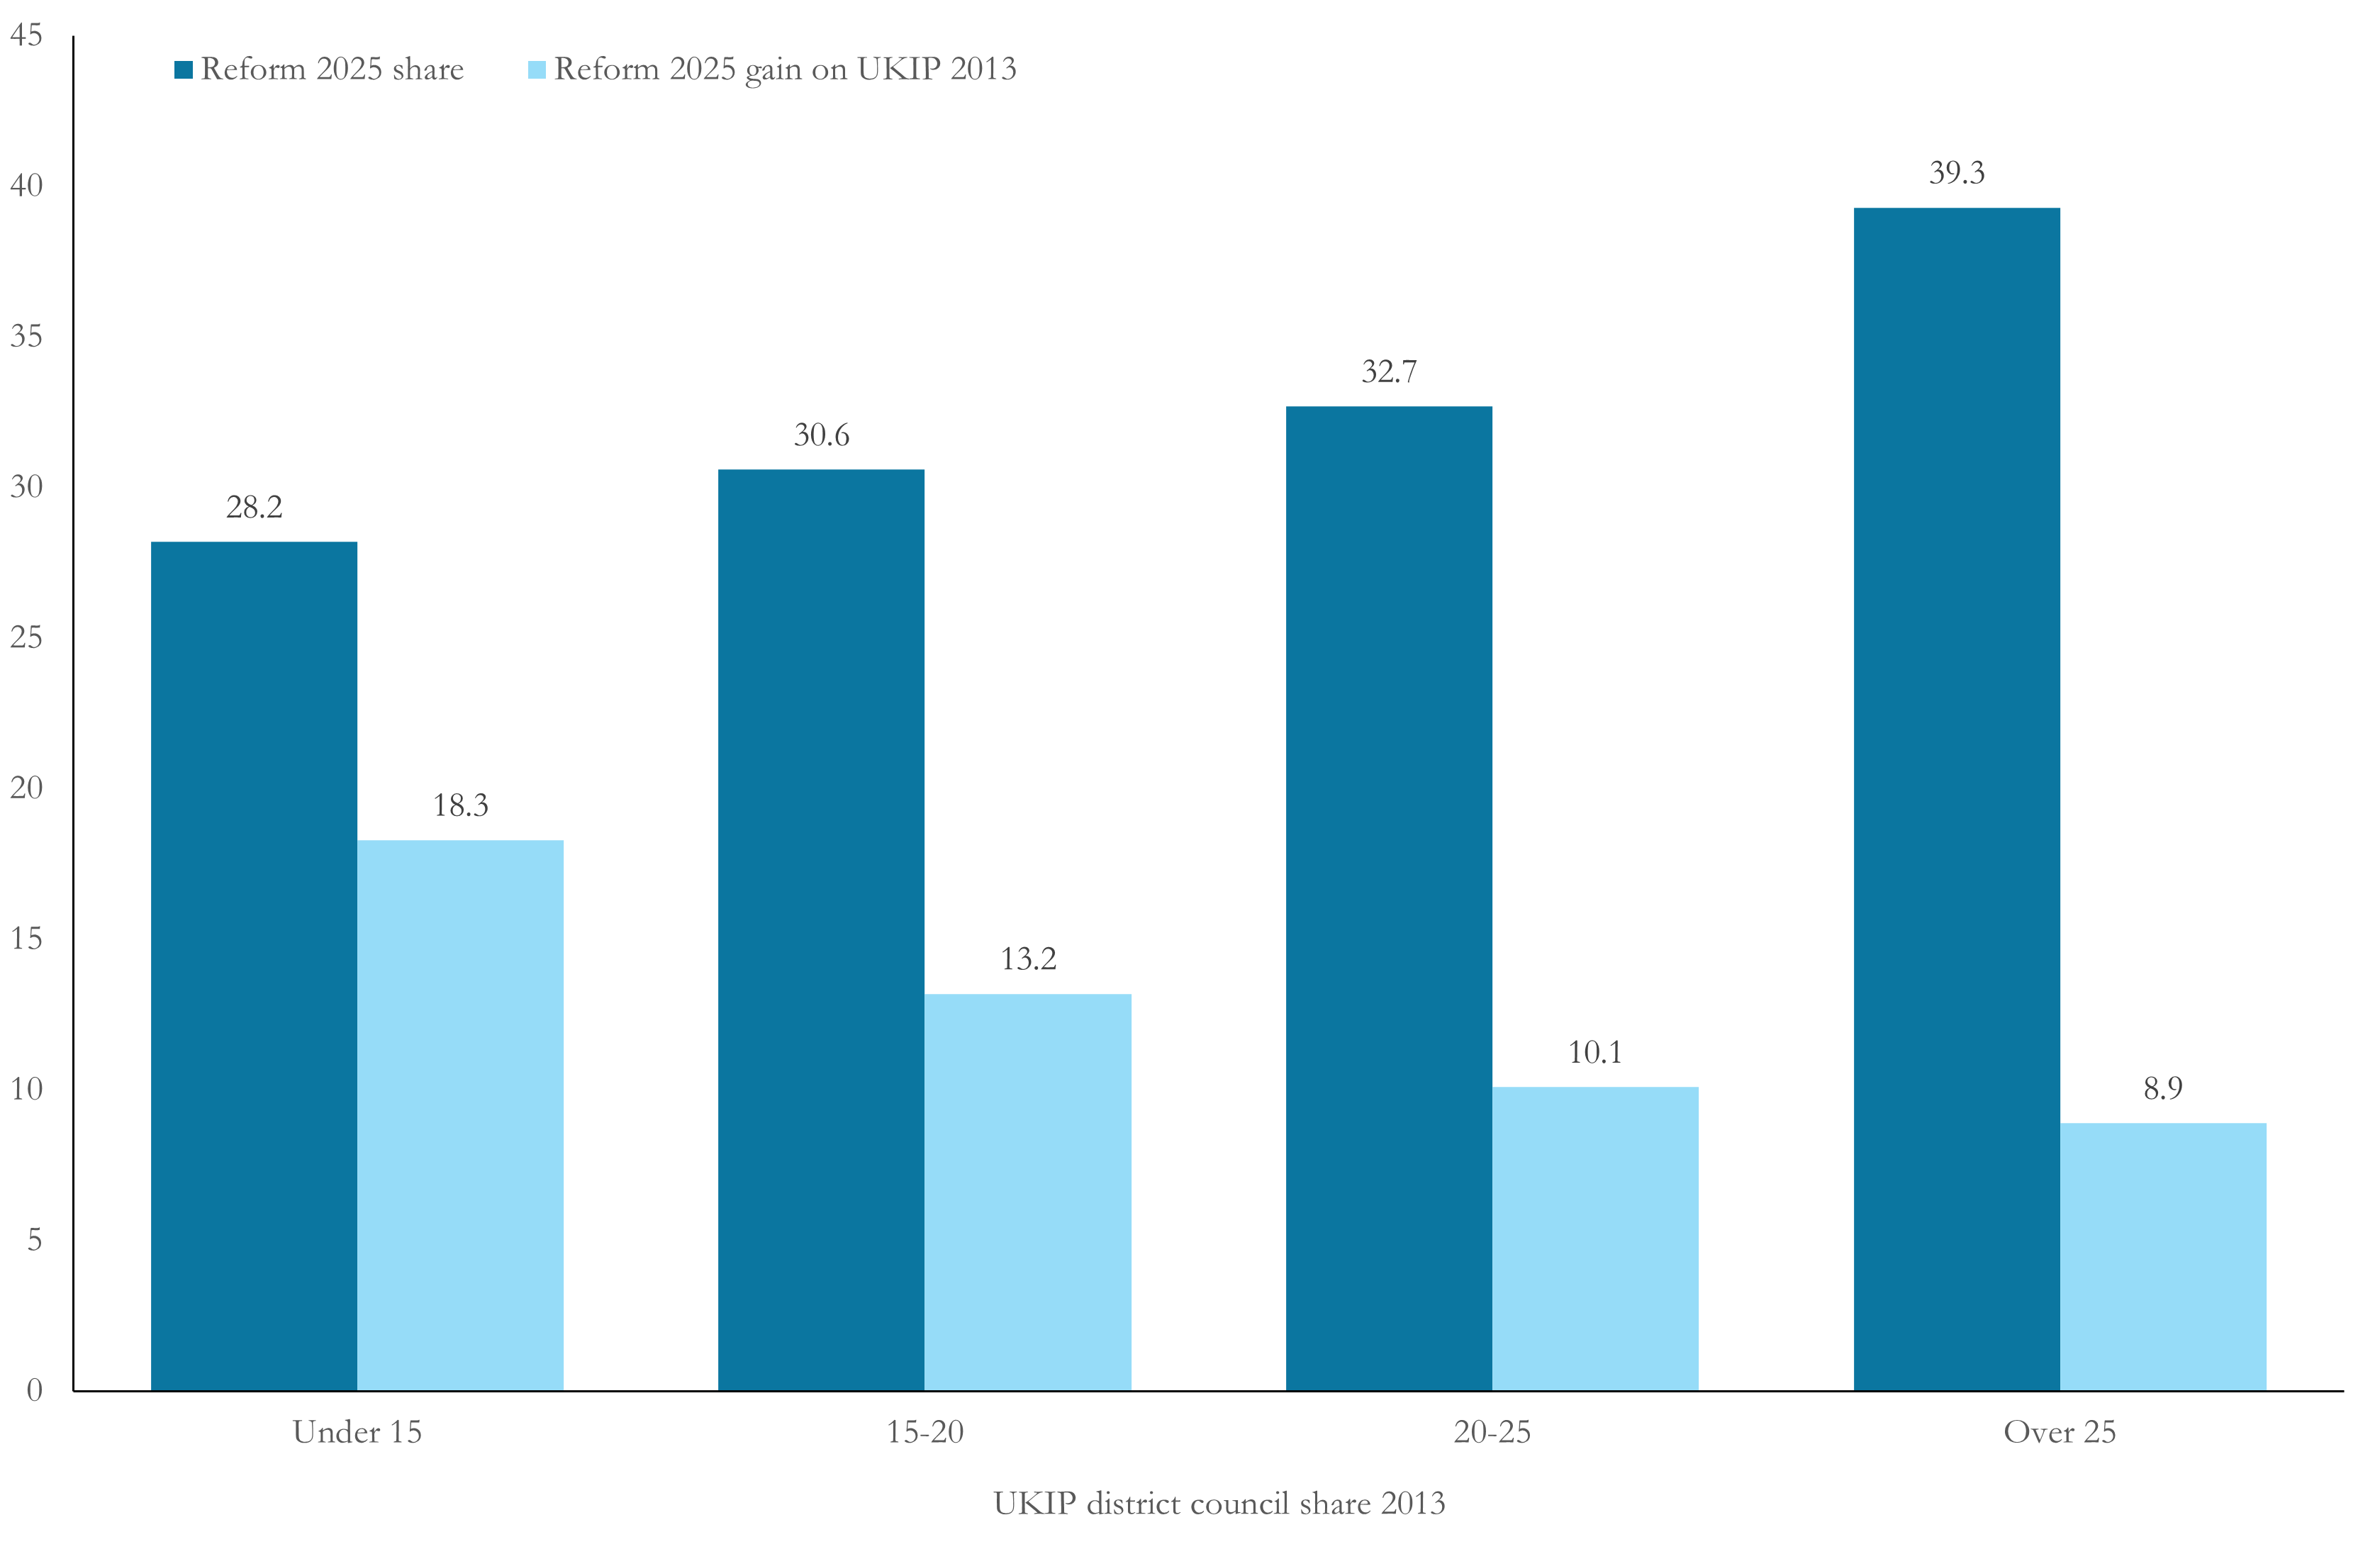
Source: BBC local elections database
Boundary changes mean we can’t directly compare Reform’s 2025 performance with UKIP’s 2013 showings at ward level, but we can aggregate up to the level of district councils, whose boundaries haven’t changed, and use that for comparison. Figure 5 takes a look at Reform’s average performances by district broken down by UKIP’s average performances in 2013. Two things are clear. Firstly, Reform does better today in places where UKIP did better a decade ago: Reform average 28.2% in districts where UKIP managed less than 15%, but Reform returned a whopping 39.3% on average in districts where UKIP polled over 25% 12 years ago. Secondly, Reform outperform UKIP most where the latter was weakest in 2013. Reform are on average 9 points stronger than UKIP in the strongest UKIP districts, but Reform 2025 beat UKIP 2013 by an average of 18 points in districts where UKIP was weakest.
Reform support is both bigger and broader than UKIP’s was. And that, crucially, means Reform are getting up to and over the 30% threshold where seats start to fall in a very wide range of places, including many places where UKIP flopped 12 years ago.
A lower bar to clear
Another reason Reform gains were so dramatic is that fragmentation has substantially lowered the bar for victory. The universal five or more party competition seen for the first time in last year’s Westminster elections came to local elections this year, as five parties - the Conservatives, Labour, the Lib Dems, Reform and the Greens - all putting up more than 1,000 candidate. Throw in smaller regional, local and independent candidates and local voters routinely found themselves with half a dozen or more candidates to choose from. More votes split more evenly across multiple candidates means a lower bar of victory for the winner.
Figure 6: Median winning vote shares for each party and overall, 2021 and 2025
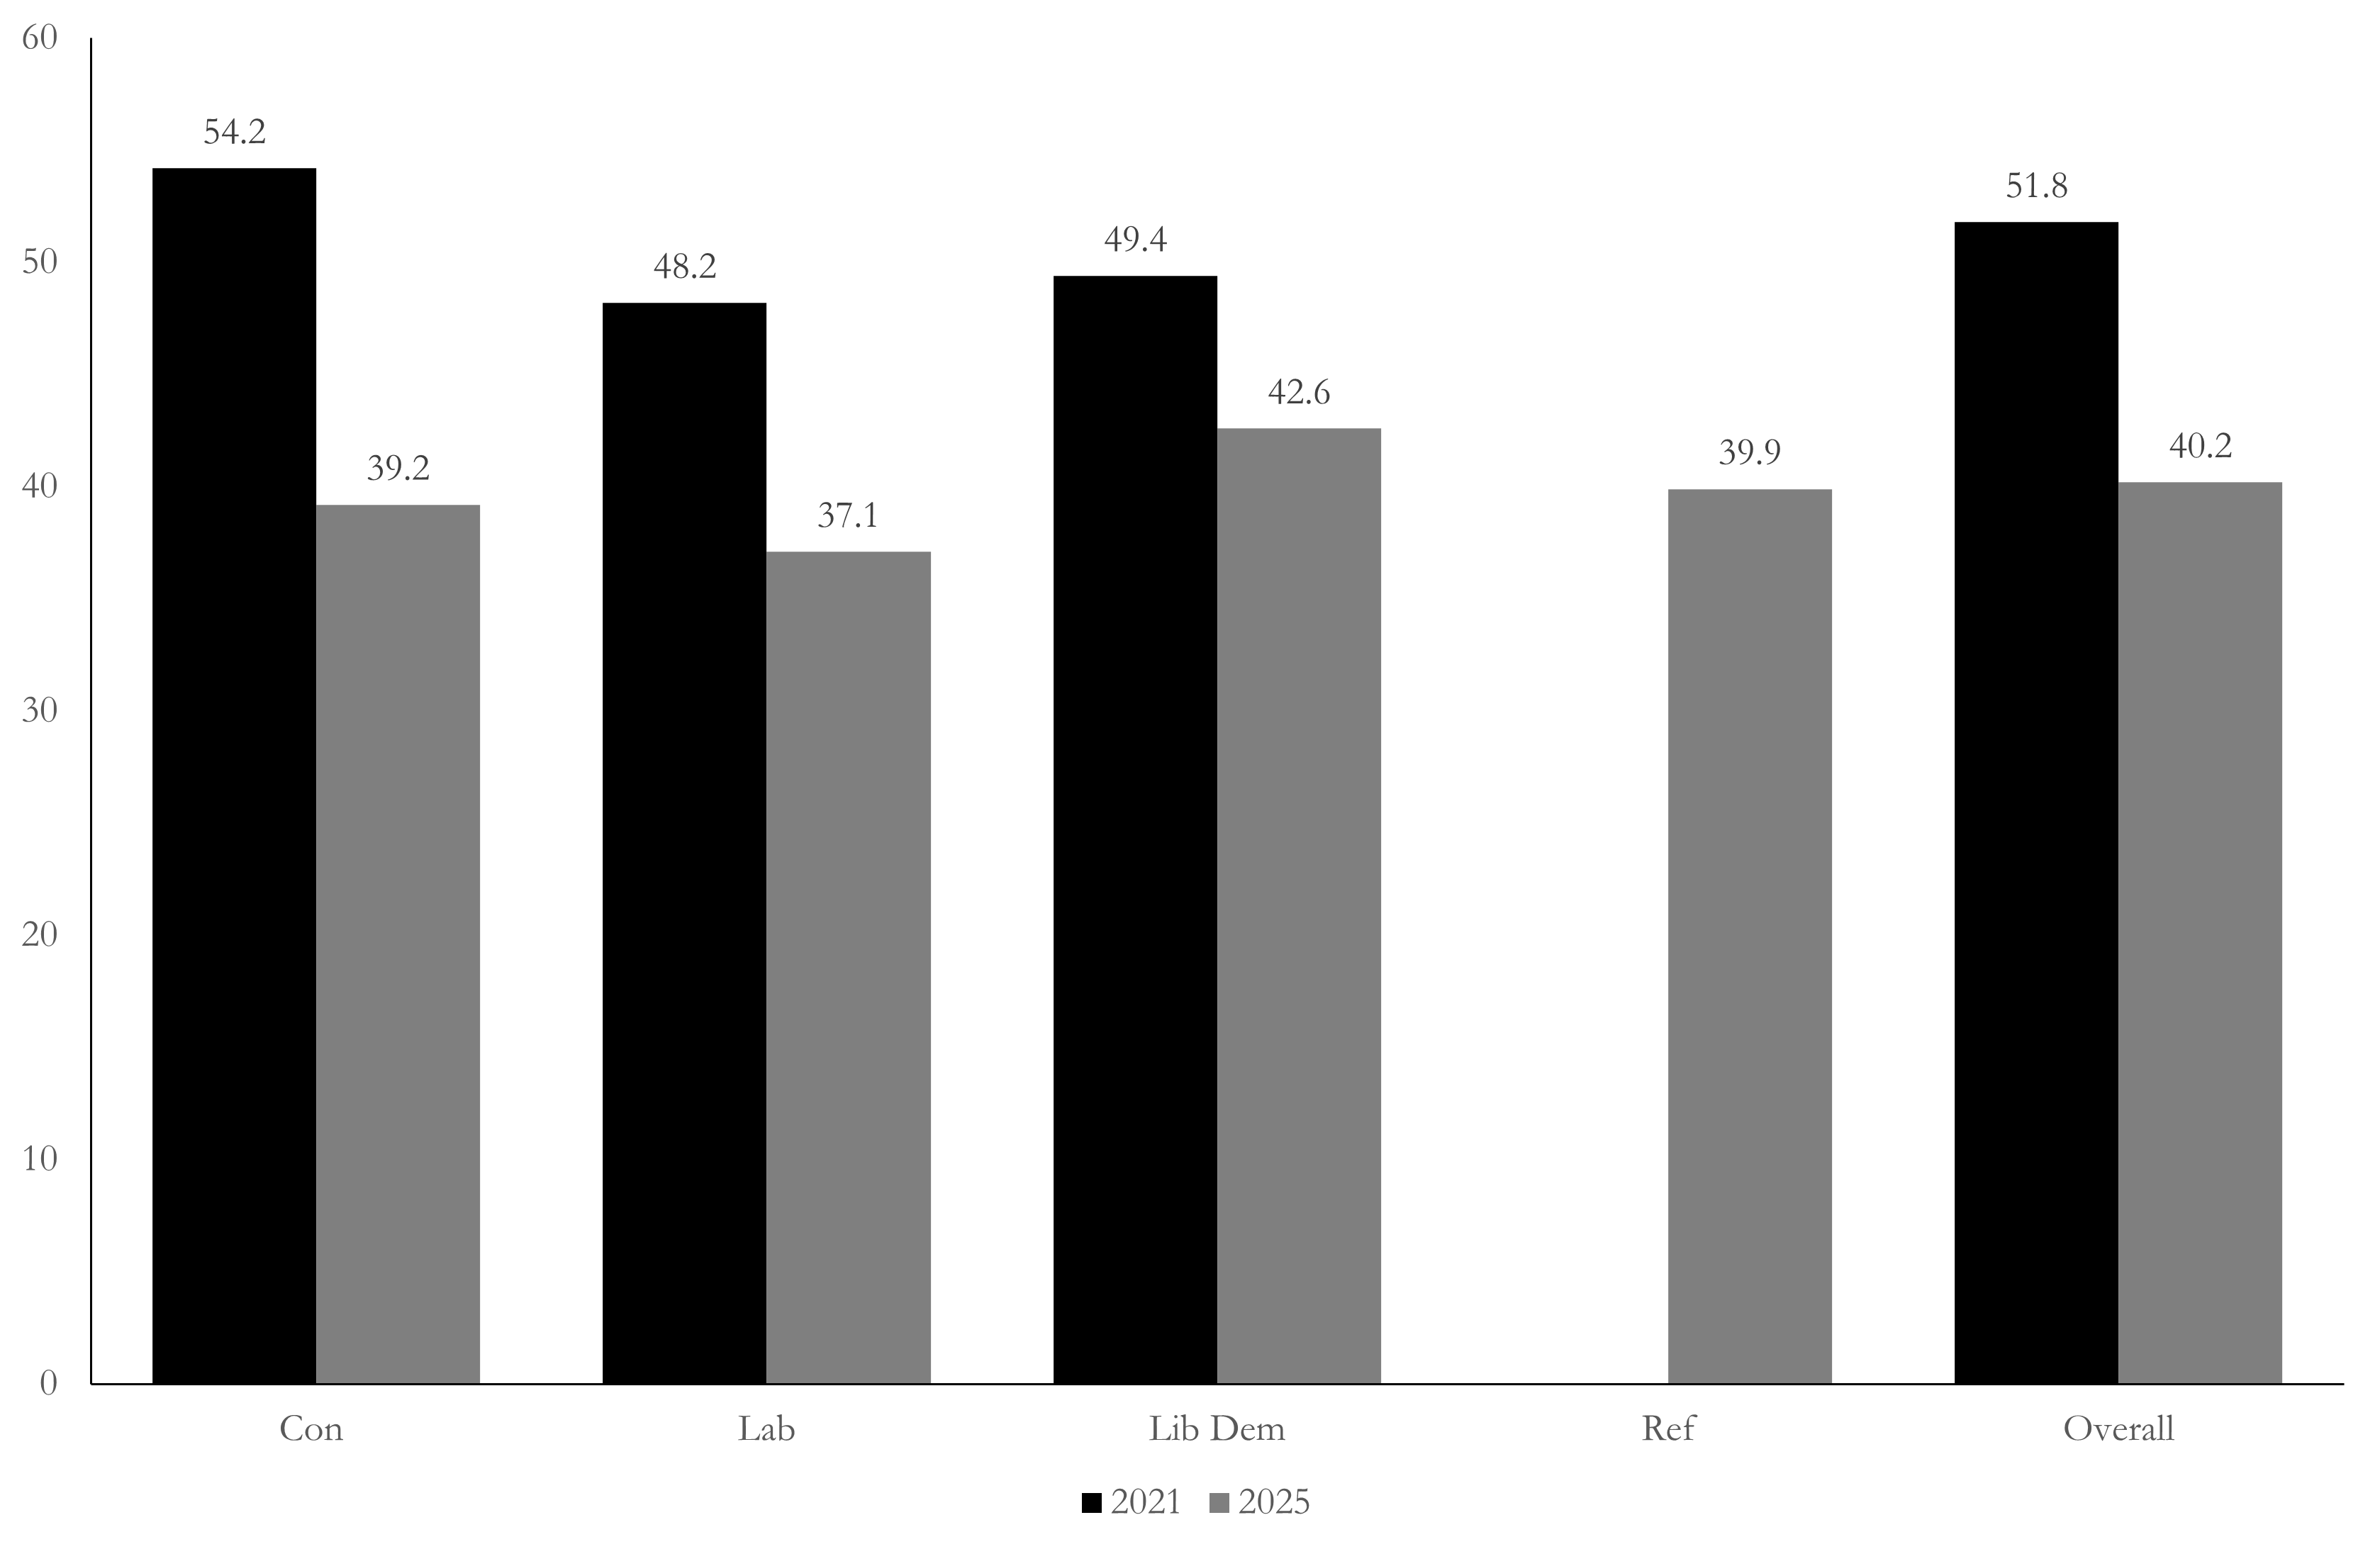
Source: BBC local elections database
The median vote share for the winning party in 2025 was 40%, 12 points lower than the average winning share four years ago.4 In nearly a quarter of wards, the winning vote share was 35% or less, meaning twice as many voters who case ballots voted for someone else as backed the local winner (and, given low turnout in local elections, this means the local winner secured the support of perhaps a fifth of locally eligible residents).
Bigger springs in the springboard? Why Reform could do even better in May 2026
Reform won big in May because their vote had become big enough and broad enough to regularly prevail over divided opposition in a fragmented electoral environment.
The earthquake next year could be as bigger, or even bigger. Reform was polling in the high 20s in the months before the May locals, now it is polling in the low 30s. As we have seen, 30% is the crucial threshold where seats begin falling in large numbers. Reform fell just short of that threshold in many wards and on many councils this year, so even a small advance in overall support could have a big impact next time. The FPP springboard launching Reform upwards may be getting bigger springs.
Meanwhile, both of Reform’s main opponents - Labour and the Conservatives - have declined further in the polls, eroding the core support they need to hold off Reform challenges. Voting preferences are now more fragmented than ever, with the Lib Dems and the Greens both advancing, and a potential new Corbyn-Sultana party adding to the mix. This will further lower the bar for Reform, whose growing poll leads make them the electoral Snow White in a land of political dwarves:
The electoral landscape in autumn 2025 illustrated
This is electorally suboptimal for the dwarf parties
Council by-elections held since the May locals have underlined Reform’s large and growing advantage from the electoral system. In the ten months period from last July’s general election to this year’s local elections, Reform gained 14 seats in council by-elections. In the four months after the locals they gained 33, 15 from Labour and 12 from the Conservatives.5 A number of these gains came in chaotic contests with votes split three, four or even five ways:
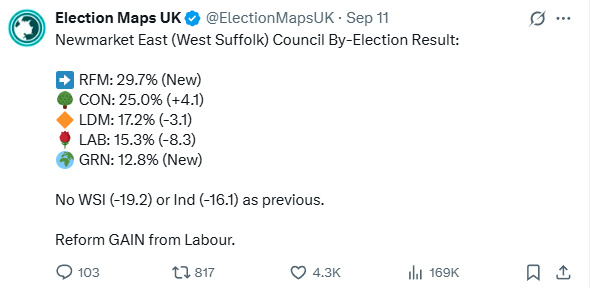
Messy!
Reform can carry on winning on 30% of the vote or less so long as its opponents remain divided. But will they? Reform’s greatest strength - its leading position in a fragmented landscape - is also its greatest potential weakness. Voters who reject Reform still outnumber those who support it by more than two to one. Reform can be defeated if its opponents can come together. And repeated waves of Reform success could help trigger that consolidation, by underlining that a Farage government is a credible possibility to voters who strongly oppose that outcome.
A less Reform favourable electoral landscape, illustrated
But who gets to be at the top of the trenchcoat?
But while the electoral case for co-ordination is obvious, achieving it in practice won’t be easy. The most obvious electoral collaborators, the three main parties of the English ‘left bloc’ - Labour, the Lib Dems and the Greens - may all share an intense opposition to Reform, and all stand to gain from electoral cooperation - but they will disagree profoundly about who should step aside, where and why. Why would Labour, by far the biggest of the three, give up on seats where it is traditionally strong? Why would the Lib Dems or the Greens, stand aside in seats where Labour’s decline may offer them new opportunities? Why would progressive opposition parties prop up an unpopular government whose policies they oppose, when they too often stand to profit from its decline? These aren’t easy questions to answer. But if Farage’s opponents don’t figure out a new approach ahead of next May’s contests, then all of his squabbling opponents may find themselves inundated by another turquoise tidal wave.
This should serve as a cautionary reminder for anyone projecting the current landscape through to an election still nearly four years away. The press in autumn 2021 was full of articles declaring the Starmer project dead, and predicting another decade of Tory rule. These have not aged well. Go back another four years and you’ll find a slew of articles arguing Corbyn’s remarkable campaign surge in the 2017 election had put him on the brink of power. Those haven’t aged well either.
Most of the remaining charts in this post were compiled using data collected by the BBC’s elections team. I am grateful to Julia Walker and her BBC results team for all their excellent work collecting the results data, to my colleagues on the psephology team John Curtice, Stephen Fisher, Patrick English and Lotte Hargrave for all their assistance putting together and analysing the dataset, and to my producer Tim Hammond for keeping me caffeinated and sane through the marathon counting process.
Reform won a majority of seats on every one of the ten councils where their average vote share was over 33%, except Leicestershire where they won 46% of the seats and formed a minority administration
I use the median - the number that splits each group exactly in half - rather than the mean, because the median is less prone to being skewed by extreme results.
I am grateful to David Cowling for these statistics.
What a dreadful voting system FPTP is for a five party contest.
It's about time England and Wales aped Scotland and NI, and introduced STV for local government.
Great to see a return of the blog! Thank you for such a clear presentation of how FPTP is now working so well for Reform, giving it a disproportionate number of seats for its vote once the 30% threshold is reached.